|
Nagios : Add Monitoring Target Host#3
2015/02/23 |
|
It's possible to monitor Windows servers on the network.
For example, add Windows Server 2012 R2 for monitoring target.
|
|
| [1] |
Download "NSClient++" and upload it on target Windows server.
⇒ http://sourceforge.net/projects/nscplus/ |
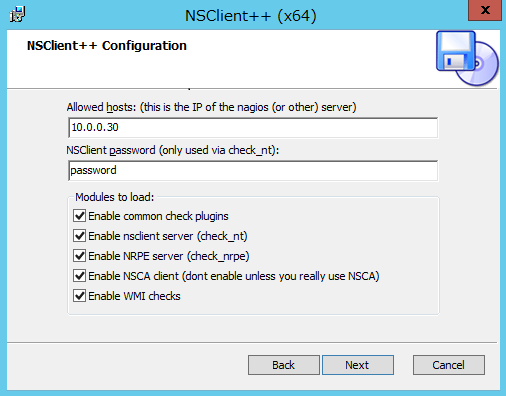
| [2] | Install "NSClient++". Input Nagios server's hostname or IP address and set any password during installation like follows. The password is used for the connection from Nagios server to Windows server for monitoring. |

|
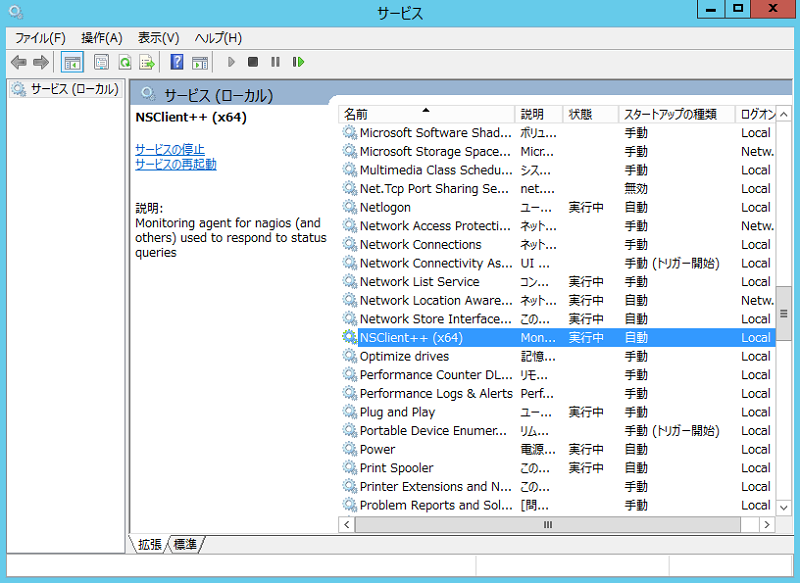
| After installing, NSClient++ has been started. It's not need to change windows firewall settings because installer has done it. |

|
| [3] | Configure Nagios server. |
|
[root@dlp ~]#
vi /etc/nagios/objects/commands.cfg # line 210 : add the password you set on Windows command_line $USER1$/check_nt -H $HOSTADDRESS$ -p 12489 -v $ARG1$ $ARG2$ -s password
[root@dlp ~]#
vi /etc/nagios/servers/windows.cfg # create new # define target hosts
define host{
       use                      windows-server
       host_name                fd3s
       alias                    fd3s
       address                  10.0.0.100
       }
define hostgroup{
        hostgroup_name          windows-servers
        alias                   Windows Servers
        }
# for ping
define service{
       use                      generic-service
       host_name                fd3s
       service_description      PING
       check_command            check_ping!100.0,20%!500.0,60%
       }
# for NSClient++ version
define service{
        use                     generic-service
        host_name               fd3s
        service_description     NSClient++ Version
        check_command           check_nt!CLIENTVERSION
        }
# for uptime
define service{
        use                     generic-service
        host_name               fd3s
        service_description     Uptime
        check_command           check_nt!UPTIME
        }
# for CPU load
define service{
        use                     generic-service
        host_name               fd3s
        service_description     CPU Load
        check_command           check_nt!CPULOAD!-l 5,80,90
        }
# for memory usage
define service{
        use                     generic-service
        host_name               fd3s
        service_description     Memory Usage
        check_command           check_nt!MEMUSE!-w 80 -c 90
        }
# for disk space
define service{
        use                     generic-service
        host_name               fd3s
        service_description     C:\ Drive Space
        check_command           check_nt!USEDDISKSPACE!-l c -w 80 -c 90
        }
# for explorer
define service{
        use                     generic-service
        host_name               fd3s
        service_description     Explorer
        check_command           check_nt!PROCSTATE!-d SHOWALL -l Explorer.exe
        }
# for IIS
define service{
        use                     generic-service
        host_name               winserver
        service_description     W3SVC
        check_command           check_nt!SERVICESTATE!-d SHOWALL -l W3SVC
        }
/etc/rc.d/init.d/nagios reload Running configuration check...done. Reloading nagios configuration...done |
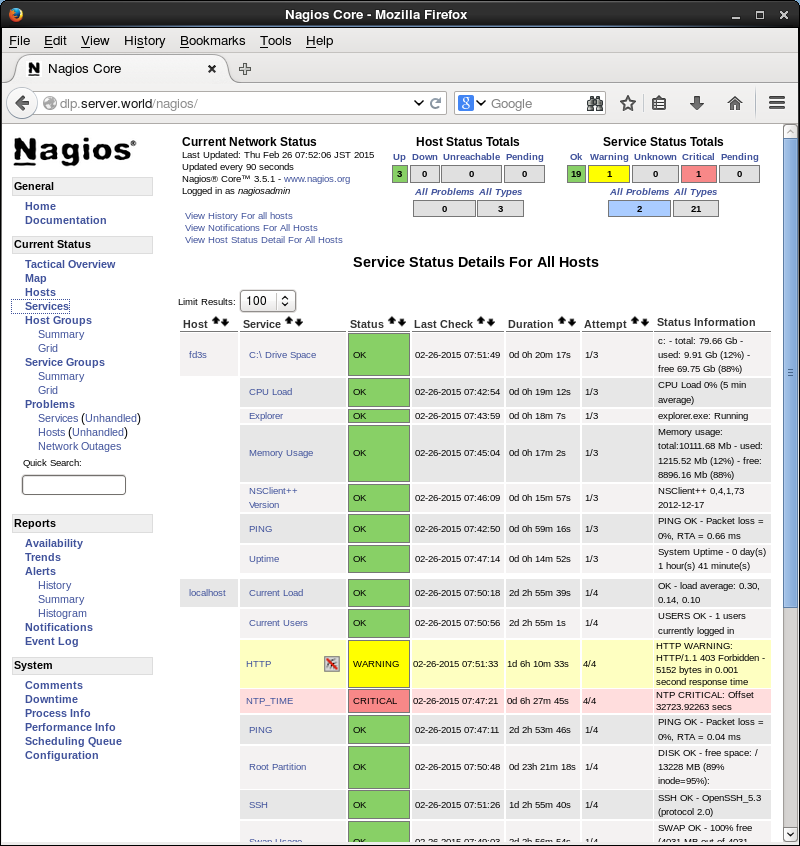
| [4] | It's possible to view the status for a new server on the admin site. |

|